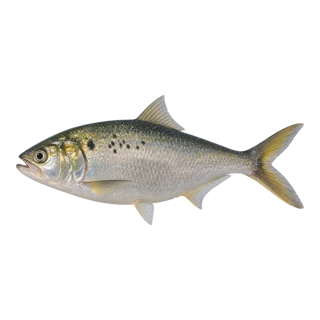
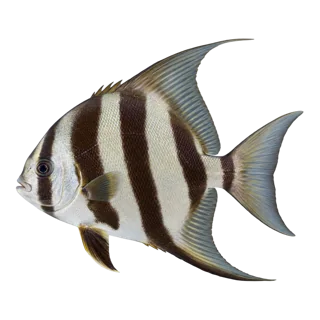
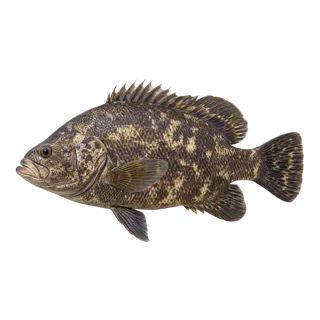
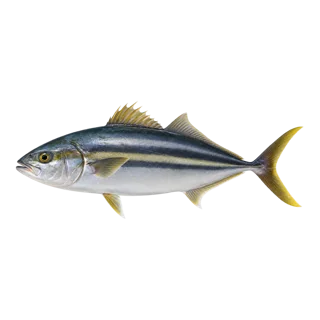
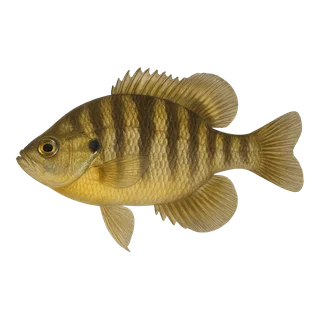
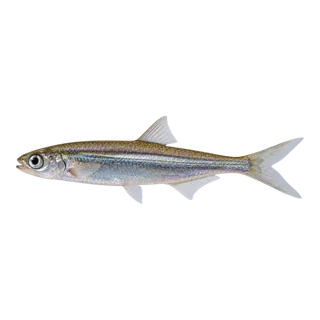
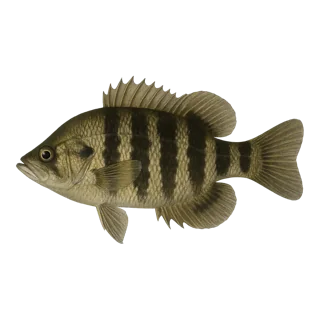
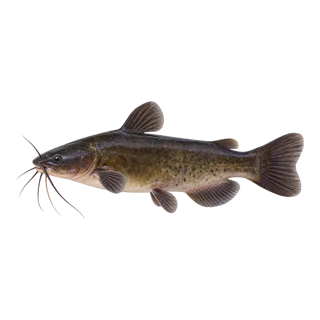
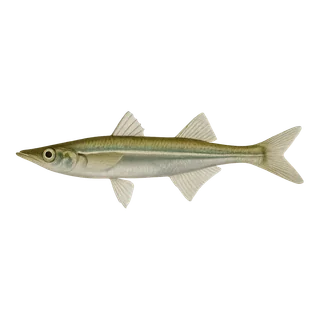
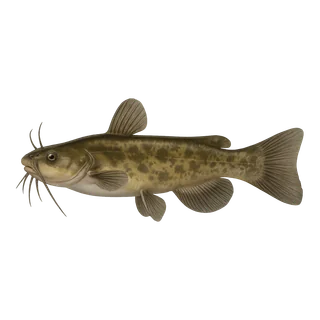
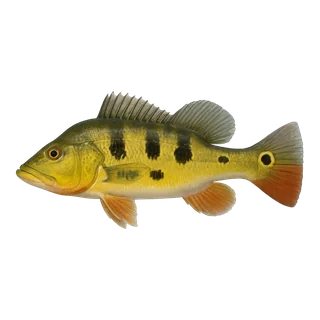
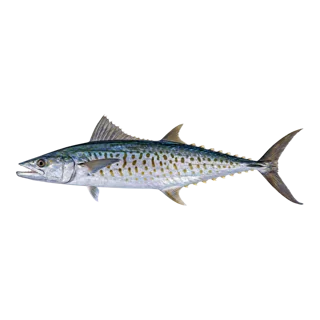
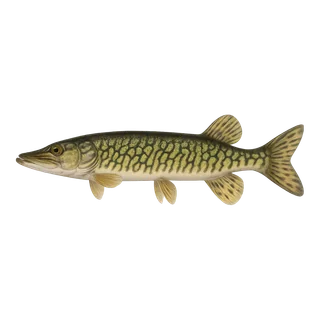
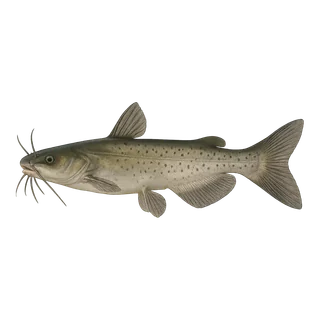
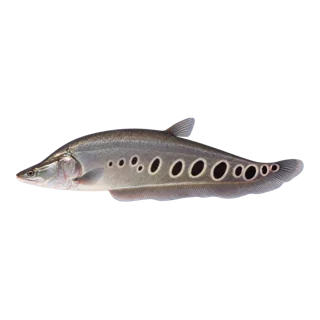
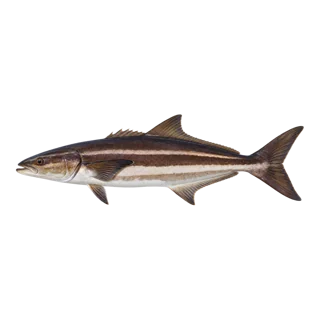
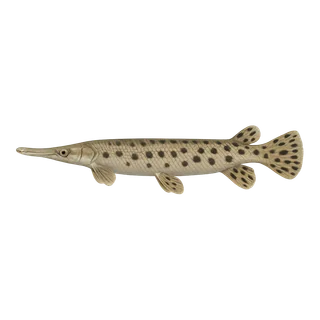
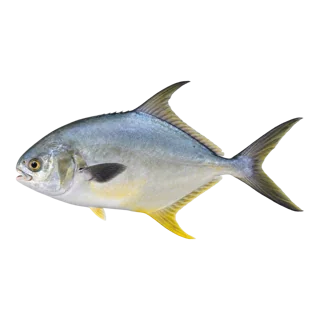
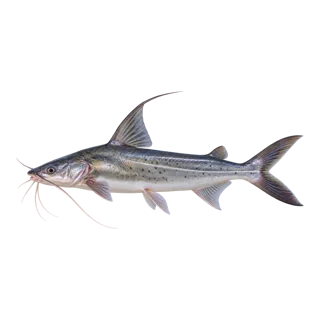
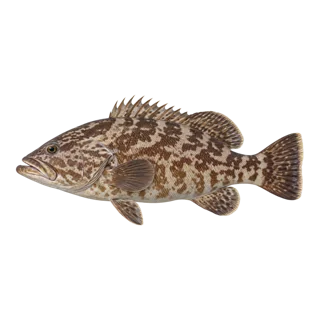
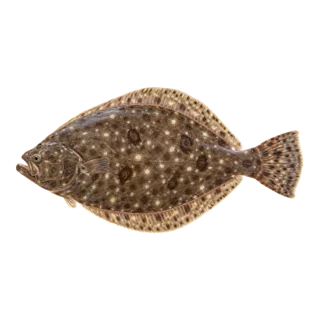
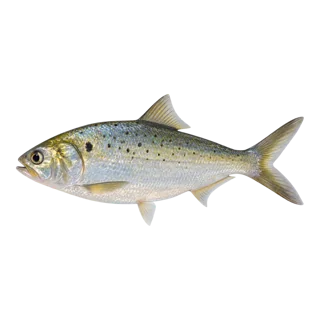
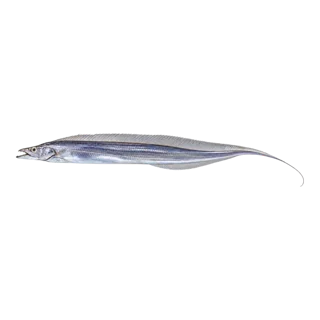
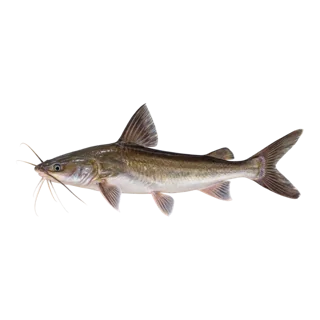
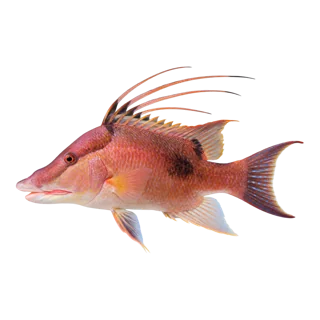
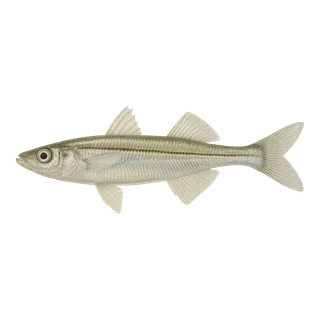
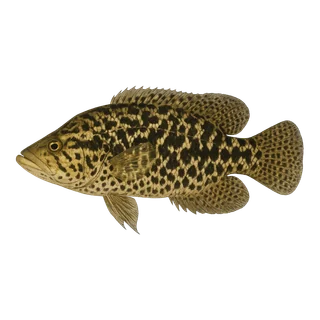
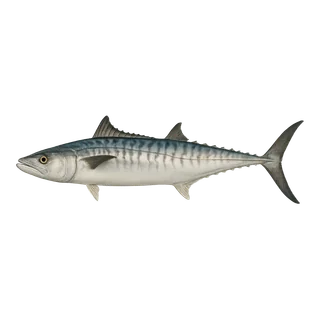
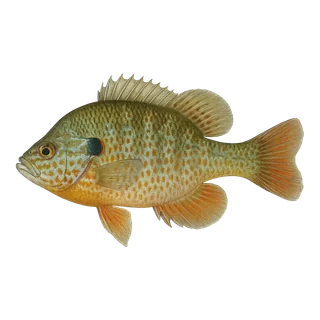
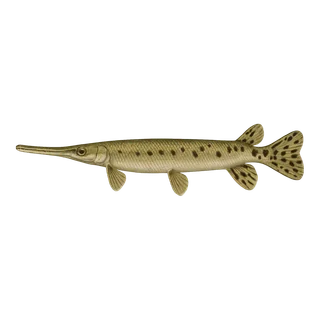
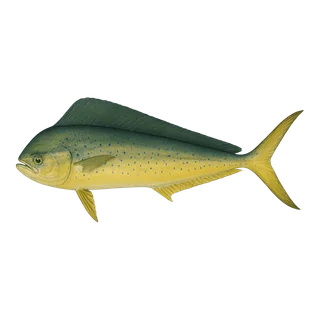
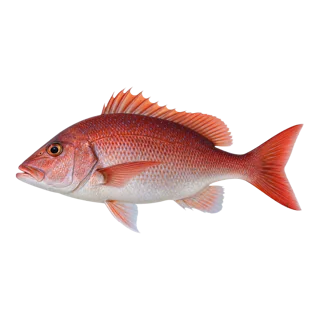
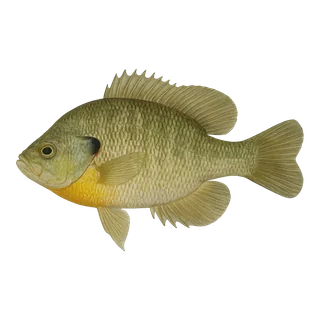
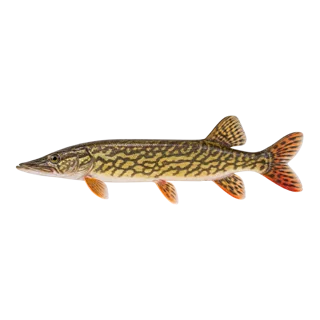
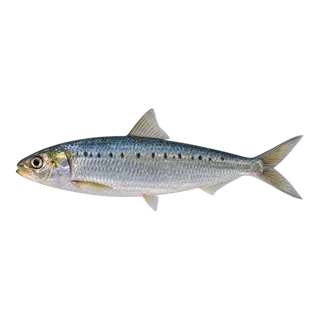
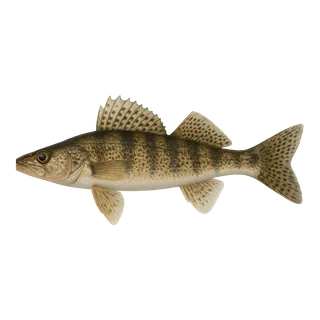
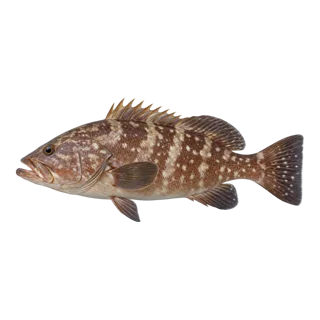
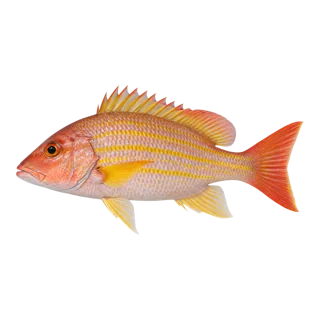
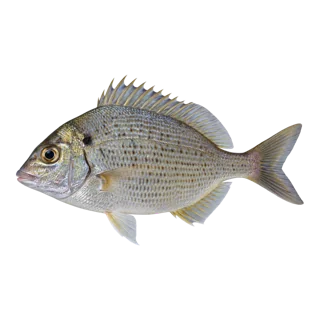
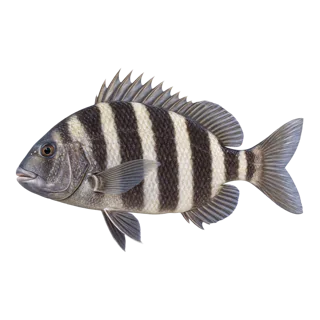
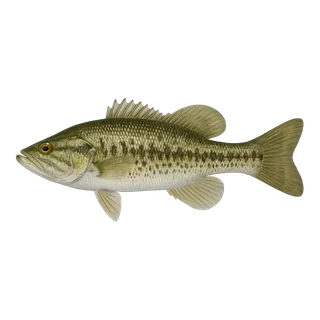
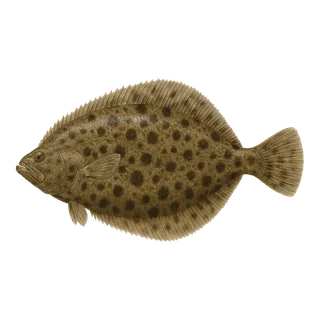
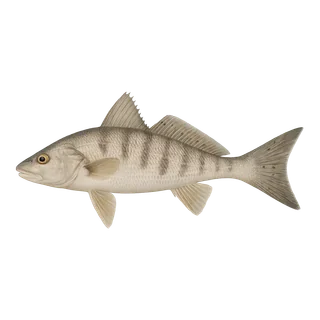
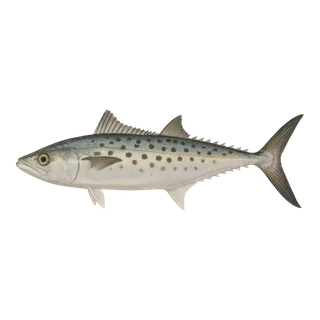
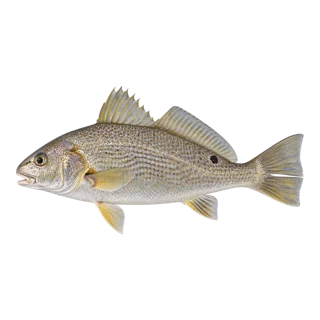
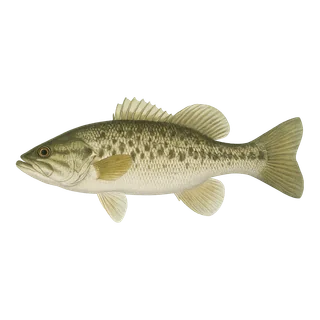
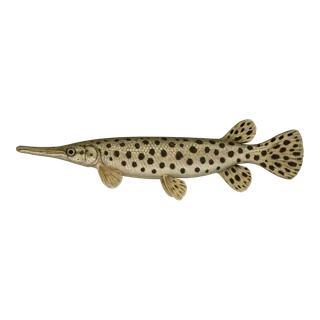
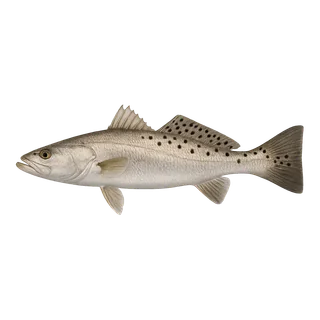
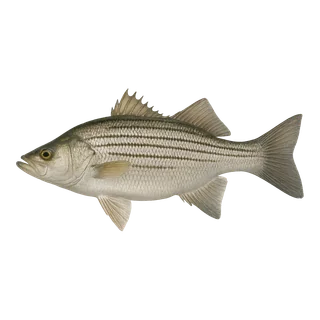
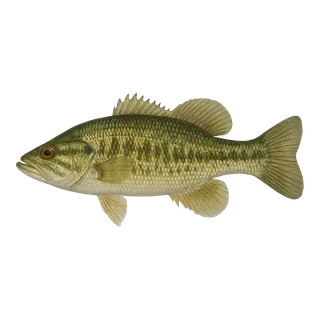
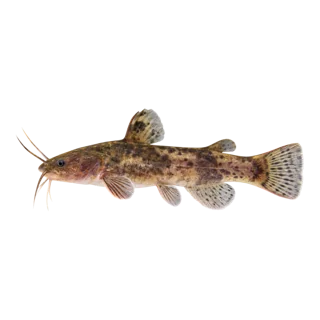
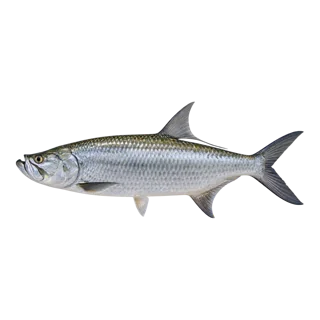
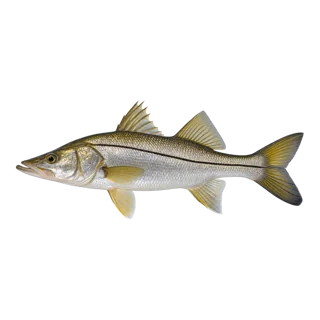
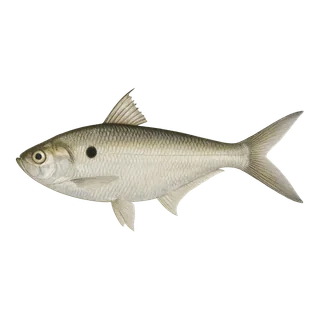
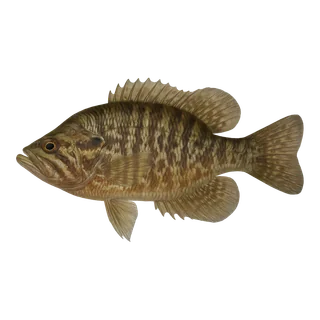
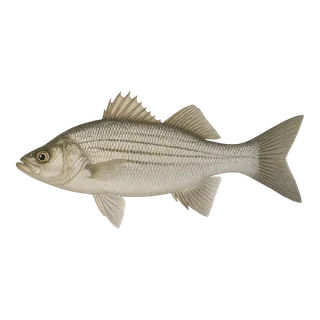
Every water page shows two different things about timing, and they are built in completely different ways. One is the calendar: twelve months per species. The other is the daily score: how good today looks. Here is what is inside each.
The daily score
The number you see for today is built from weather, and the weights are not evenly spread. Out of a hundred points:
- Air pressure — 28 points. The biggest single factor. Fish feel pressure through the swim bladder, and a steady, moderate pressure is what they feed in.
- Which way pressure is moving — 18 points. A falling barometer ahead of weather lifts feeding. A sharp rise after a front shuts it down. This is the classic "fish before the storm" and it holds up in the data.
- Air temperature — 12 points. A rough stand-in for water temperature today, because water temperature is measured occasionally and air temperature is measured everywhere, every hour.
- Wind — 10 points. A little chop helps. A hard blow hurts the fish and the fisherman both.
- Moon phase — 6 points. Solunar window — 6 points.
- Cloud — 5, rain — 5, time of day — 5. Overcast makes fish bolder than bright sun. Light rain on the surface helps; a downpour does not. Dawn and dusk get their points.
Why the moon is only worth six points
Because that is what the evidence supports. A direct field test of solunar theory (Quigley, 2023) found no link between solunar windows and catch, while pressure and temperature show a steady effect on feeding.
We could have dropped the moon entirely. We kept it visible and small: the tradition is there for the anglers who plan by it, but it does not decide the score. That is an honest compromise rather than a fashionable one.
The lake's own water pulls the score down
After the weather score is calculated, we apply what we know about that specific water. If our own oxygen readings show the lake is low, the score drops — by about 12% for low oxygen, by nearly 30% when it is bad enough to call hypoxia.
This is where our data beats a generic forecast. A weather app knows the barometer over your town. It does not know that this lake ran out of oxygen three weeks ago.
The twelve-month calendar
The calendar is a different animal. Each species has a twelve-month curve of when it feeds — that curve is a national average, built from what the species does across the whole country.
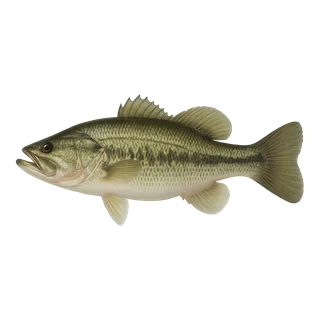
A national average is wrong almost everywhere by itself. Largemouth bass spawn in February in Florida and in late May in Michigan, and the bite follows the spawn. So we move the curve by latitude: about four days for every degree, north being later. That is Hopkins' bioclimatic law, and it is the same rule the state agencies use in their own guides.
For Florida this works out to roughly six weeks earlier than the national curve. The shift is fractional, not whole months — 39 days is a month and a third, and rounding it to a whole month would throw away a third of the correction.
What neither of them knows
The daily score describes conditions, not your catch. It does not know how many boats were on the lake yesterday, whether the fish are spawning, or that somebody ran nets last night.
The calendar does not know that a northern January is under ice. Latitude moves a curve in time; it cannot flatten it. That is why every calendar prints how many weeks of adjustment are in it, and why the honest next step is a calendar built from readings on the lake itself, rather than a cleverer formula.