Subscription
Around $39 a year for the forecast, alerts, offline maps and saved trips. Explained above.
Before a trip, an angler wants to know three things: how deep is it, where can I put the boat in, and will the fish bite on Saturday. The data exists — the federal government and every state publish it for free. It is just scattered across a dozen websites in a form no normal person can read. We collect it, clean it, and turn it into one clear page per lake.
One American in six went fishing last year. Every figure below comes from the same report, published in July 2026 and covering 2025, so the numbers can be compared with each other.
| What | How many | What it means for us |
|---|---|---|
| Americans who fished in 2025 | 57 million | About 18% of the country. Down from 57.9 million in 2024 — the first drop since 2021. |
| Freshwater anglers | 41.6 million | Lakes and rivers: exactly what we cover, and the only number on this table that is our actual market. It has held steady four years running. |
| Fishing outings in 2025 | 918 million | About sixteen trips per angler per year, and every one of them starts with the same question: where do I go this weekend. |
| What anglers spend a year | about $100 billion | Equipment, licenses, outings and related expenses. We do not need a share of it. We need to be the page people read before they spend it. |
| Anglers who stopped fishing in 2025 | 19 million | The highest churn on record, and the industry's own biggest worry. People do not quit because fishing got worse — they quit after enough wasted trips. That is the thing we prevent. |
Source: the 2026 Special Report on Fishing, published by the American Sportfishing Association on 29 July 2026 for the 2025 season. The spending figure is ASA's separate Sportfishing in America report (March 2025), which also puts the industry's total contribution to the US economy at $230.5 billion and 1.1 million jobs — a different number with a different meaning, which is why it is not in the table. These are the only figures on this page we did not measure ourselves. Everything else comes from our own database and updates automatically.
Nothing in our data is new. What changed is the cost of turning it into something a person can read.
Agencies that mailed PDFs now publish machine-readable feeds and open APIs. The material we depend on became fetchable rather than scannable.
Depth soundings, shoreline geometry and vector tiles used to need a GIS department. The same work now runs on one rented server we already pay for.
Turning a thousand rows of water chemistry into two readable paragraphs — in two languages — used to be a person's afternoon. It is now a step in the pipeline, checked by an editor rather than written by one.
The question 'where do I go this weekend' is now asked into a screen, not at a tackle counter. The market moved to where the answer can be delivered.
The data existed before. Doing this nationally became affordable only recently — which is why the window is open and will not stay open long.
An app can be copied in a month. The database cannot. Every number below comes from somewhere public and free: the USGS maps the shorelines, NOAA measures the depths, state agencies list the boat ramps and what fish they released, the EPA collects the water tests. We have not found anyone who has put it together. That is the work — and once a lake is done, it stays done.
The pipeline, stage by stage
Each one has a name, a location and a real shoreline shape. 481,007 shorelines drawn in all, unnamed ponds included.
Real sonar and survey readings turned into the coloured depth bands you see on our maps. This is the hardest layer to get and almost nobody has it for freshwater.
Which fish the state released into that lake, how many, and in what year.
Our standard for a finished lake: written description, depth chart, ramps, water tests, fish list and a live bite forecast.
The distance between the first line and the last is not a hole in the product — it is the conveyor belt, photographed mid-run. Every lake in the first line is already collected; finishing one is a known amount of work done the same way every time, and we know how long it takes because we have done it. Every finished lake so far is in Florida, on purpose: one state completed end to end is worth more than a thin layer over fifty.
What one finished lake looks like
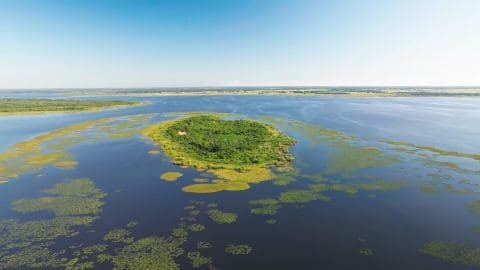
Lake Okeechobee, as an example of everything a single page contains.
This is the part nobody else does. Other sites give you a name on a map and a photo. We write a real description of every lake straight from its own measurements — how the depth is distributed, where the fish hold, what the water tests say, which ramp to use with a big boat. It is composed by our own software from the numbers on the page, not drafted by a language model and not stamped from a template: every sentence traces back to a value we can point at. That is why it can be produced for thousands of lakes and still be checkable line by line — and why our pages read like advice while theirs read like a directory listing.
Why this gets harder to copy, not easier
Thousands of separate public datasets, one federal agency and fifty state agencies, each with its own format and its own idea of what a lake is.
Different schemas, units, spellings and coordinate systems become one model. This is the part that cannot be bought.
Lake to shoreline to depth to ramp to campground to fish to water test to weather. The value is in the joins, and the joins are ours.
Water tests, stocking records and survey history pile up year after year. A competitor starting today starts with this year only.
Every angler who opens a lake page tells us which lakes matter. That is the layer that gets better with people, and it is the last one to build.
There is nothing to post and nobody to follow. The app answers where to go, when to go, and what will be biting when you get there — then gives you the drive. These are the real screens, running on live data, not mock-ups: scroll any of them.

 Free · no signup
We read the public records for every lake and river in the US — surveys, ramps, water tests, stocking — and turn them into one page you can act on.
Every published water gets the same page: surveyed depths, species with bite calendars, water tests, stocking, ramps with lanes and hours, camps on the bank — and the score for the day you are going.
Where are you fishing from?
So we can sort lakes by how far you have to drive, and use the right bite calendar for your latitude.
Use my locationYour location stays on this phone. We never store it.
Skip — show me everything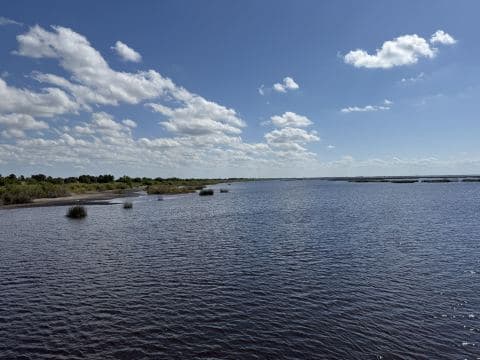
lake · Florida · Clewiston
Private pins on the depth chart — nobody else sees them
Lake Okeechobee Fishing Guide: Largemouth Bass, Black Crappie, Bluegill & Best Spots At a Glance: What to Fish, When, and Where to Start Lake Okeechobee is Florida’s biggest lake and a national destination for trophy largemouth bass, black crappie (speck), and bluegill. The best months for big bass are March, April, October, and November, with strong bites for crappie in winter and early spring. You need a boat to fish most of the lake—shore access is limited. Start your trip at the Clewiston City Marina or the City of Belle Glade - Torry Island Public Boat Ramp - Pavillion Side, both with six lanes and paved parking. Focus on the o…
Read the full description6 waters · 2 camps · 1 trip planned
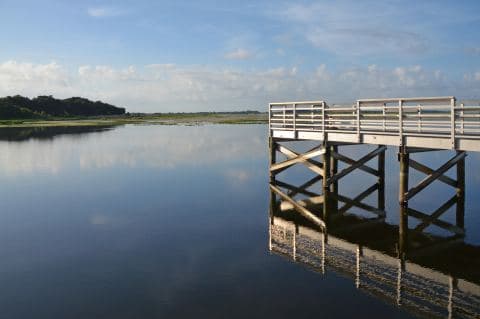 Lake TohopekaligaLaunch: Brinson Park
 Lake KissimmeeOvernight · Camp Mack River ResortLake OkeechobeeLaunch: Alvin L. Ward Park - Caloosahatchee Canal Ramp (Steep drop-off during low water)
Every stop ends at a boat ramp, not in the middle of the lake. Drag to reorder — the order is your call, not the algorithm’s. Planning is free; the turn-by-turn drive and offline charts are Plus.
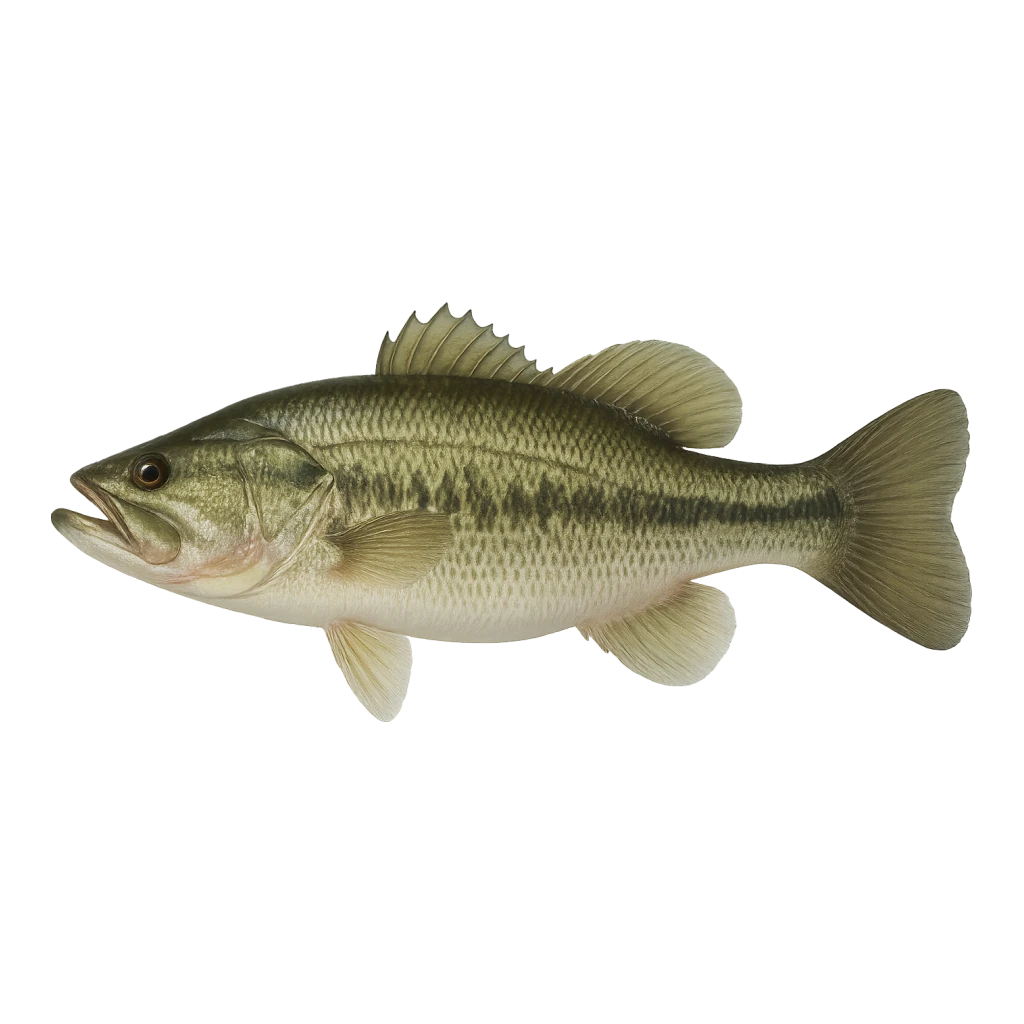
Micropterus salmoides
Use a variety of lures such as plastic worms, crankbaits, and spinnerbaits. Target shallow areas near cover like weeds, rocks, or fallen trees. A popular rig is the Texas rig for worms, which allows for weedless presentation.
Largemouth bass spawn in shallow waters during spring when temperatures reach around 60°F. They primarily feed on smaller fish, crustaceans, and insects. Their habitat includes lakes, ponds, and slow-moving rivers with plenty of cover.
Largemouth bass are driven to bite by changes in water temperature and light levels. They are more active during warmer months and tend to feed aggressively during dawn and dusk when prey is most active.
The Largemouth Bass (Micropterus salmoides) is a robust freshwater fish. It has a broad, flattened head and a large mouth that extends past its eyes. The body is typically olive green to dark green with a lighter belly. A distinctive dark stripe runs along each side, from the snout to the base of the tail. The dorsal fin is divided into two parts, with the first part spiny and the second part soft. The Largemouth Bass is often confused with the Smallmouth Bass (Micropterus dolomieu). The key difference is that the Largemouth Bass has a larger mouth that extends beyond its eyes, while the Smallmouth Bass has a mouth that does not extend past its eyes. Largemouth Bass are found throughout the United States, from the Northeast to the Southeast and into the Midwest. They prefer warm, freshwater habitats such as lakes, ponds, rivers, and reservoirs. They typically inhabit shallow waters, often in depths of 1 to 15 feet. Largemouth Bass are known to seek cover in structures like submerged logs, rocks, and aquatic vegetation. In spring and summer, they move closer to the shore for spawning and feeding. In fall and winter, they may retreat to deeper waters as temperatures drop. Largemouth Bass are most active from late spring to early fall. They bite best when water temperatures range from 65 to 85 degrees F. Early mornings and late afternoons are prime times for fishing. Weather changes, such as a passing front or increased wind, can trigger feeding activity. A full moon may also enhance their feeding behavior, making them more aggressive and active at night. To catch Largemouth Bass, anglers often use a variety of rigs and lures. Popular rigs include Texas rigs and Carolina rigs. For baits, try plastic worms, jigs, or topwater lures. Sizes for plastic worms typically range from 4 to 10 inches, while jigs can be 1/4 to 1/2 ounce. Colors like green pumpkin, watermelon, and black/blue are effective. Use a monofilament or braided line in the 10 to 20-pound test range, with hooks sized from 2/0 to 5/0. Cast near cover and retrieve slowly, allowing the bait to mimic natural movement. Vary your retrieve speed to find what triggers a bite. The typical size for a Largemouth Bass caught by anglers ranges from 1 to 5 pounds, with lengths between 12 and 20 inches. A trophy Largemouth Bass is generally considered to be over 8 pounds. Growth rates can vary based on habitat and food availability, but they can reach maturity in 2 to 4 years. Largemouth Bass can live up to 10 to 16 years in the wild. They are considered good eating, with firm, white flesh. When handling for release, wet your hands to avoid removing their protective slime layer and minimize stress by keeping them in the water as much as possible.
For the price of one tank of fuel.
Plus is the cheapest line on this list, and the only one that stops the wasted drive.
Every finished lake stays free: depth chart, ramps, water tests, fish list and today’s score.
Fair question, and it is the one investors ask first. Here is the honest answer: because a wasted Saturday costs more than a year of the subscription.
What a fishing trip already costs
Everyone already pays this. Paying once a year to go fishing is a habit, not a new idea.
Spent whether the fish bite or not.
What people pay to not waste the day. We are the cheap version of the same thing.
Four hours of driving to a lake that is muddy, closed, or dead. This is the problem we solve.
Free and paid
The pitch to the angler is one sentence: for the price of one tank of fuel, you stop driving to the wrong lake. That is an easy sentence to say in a tackle shop, and it is the reason we think this converts.
What that adds up to
This is arithmetic, not a forecast. It runs on the 41.6 million freshwater anglers — the market we actually cover — at $39 a year.
| Share of freshwater anglers | Paying users | Yearly revenue |
|---|---|---|
| 1 in 1,000 | 41,600 | $1.6M |
| 1 in 200 | 208,000 | $8.1M |
| 1 in 100 | 416,000 | $16.2M |
A 1% share of freshwater anglers would be about 416,000 paying users. We treat that as a long-term scenario, not a near-term forecast. The number we actually manage is the one before it: at a 3% visitor-to-paid rate, the first line means roughly 1.4 million angler visits a year. That is the figure we will report against, and it is the honest measure of whether this works. Subscription is also only one of four ways this earns — the others are below, and none of them need a large audience.
We do not sell the data itself. We help someone decide where to go, and we are standing right next to the money they were going to spend anyway.
Around $39 a year for the forecast, alerts, offline maps and saved trips. Explained above.
By the time someone reaches a lake page, they have already chosen the place and roughly the date. That is the best possible moment to show them a guide or a campsite. We hold thousands of ramps and campgrounds already linked to the right lake, which is exactly the connection a booking site cannot buy anywhere.
We know the lake, the month, the water temperature and which fish is feeding. Nobody else can work that out from a search box. A rod recommendation next to “bass are feeding here this week” is worth many times a banner ad.
State tourism boards want their lakes to look good and be findable. Marinas and resorts want to be the pin next to the ramp. Boating apps want our depth charts and would rather license them than send out survey boats. This one pays before we have a large audience, because it is priced on the data, not on traffic.
What each one covers, checked on their own sites
| Catch community | Depth charts | Species bite forecast | Sampled water chemistry | Stocking records | Boat ramps | Free, no subscription | |
|---|---|---|---|---|---|---|---|
| Fishbrain | |||||||
| Omnia Fishing | |||||||
| onX Fish | |||||||
| Navionics / Garmin | |||||||
| Windy | |||||||
| State agencies | |||||||
| TripsQuick |
Compiled in August 2026 from what each product documents publicly on its own site: fishbrain.com/features, omniafishing.com/map, onxmaps.com/fish, navionics.com, windy.com. A full mark means the product presents it as a named feature. A half mark means a weaker form: Navionics has community map edits but no catch log; Omnia has satellite surface temperature and clarity but not sampled chemistry; Windy forecasts weather but not fish activity. Sampled water chemistry means oxygen, clarity, pH and temperature from monitoring stations with years of history — not a surface reading from a satellite or a weather model. FishingBooker is not in this table because it publishes no lake data at all; it is a booking marketplace, and it is in the list above for the revenue stream, not the data.
| Who | What they do well | What they leave open |
|---|---|---|
| Fishbrain | The big one: over 20 million logged catches, and more product than people assume. Navionics depth maps, a seven-day forecast with BiteTime species-activity windows, BiteGuide lure advice, waypoints, plus boat ramps and marinas on the map. | No measured water: no oxygen, no clarity, no pH, no history, no stocking records. Their forecast is built from catch logs and weather; ours is built from what has been measured in that specific water. The depth maps sit behind Pro. |
| Omnia Fishing | The closest thing to us, and the one to watch. Lake-first product with Navionics HD depth charts, C-MAP contours, vegetation and bottom hardness, boat landings, fish attractors, water-level stations, satellite water temperature and clarity, and angler-filed fishing reports — all wired to a tackle shop that ships the same day. Subscription starts at the same $39 a year we plan to charge. | The water layers are satellite surface readings, not sampling-station chemistry: no oxygen, no pH, no multi-year history, no stocking records. And the business is tackle — the map exists to sell baits, which is a different company with a different centre of gravity. |
| onX Fish | Premium lake maps, 3D lake bottoms, filtering by species, trophy potential and abundance, and in-dash navigation that ends at the boat ramp. A clean product with a clear $34.99 a year. | Midwest only — twelve states as of August 2026, with no Florida and no Southeast at all. No water chemistry, no stocking, and no daily reason to open it: it answers where, not whether today is worth the drive. |
| Navionics / Garmin | The best bathymetry in the business: SonarChart HD contours built from millions of boater sonar logs, plus weather, tides, dock-to-dock routing, community map edits and ActiveCaptain points — which do include boat ramps, docks and marinas. | Built to navigate a boat, not to choose a lake. Weather but no fish-activity forecast, no water tests, no stocking. Mostly sold with chartplotters, to people who already own one. |
| Windy | Free, excellent and genuinely used by anglers: wind, rain and temperature forecasts on an hour-by-hour slider, from several weather models at once. | It is a weather map, not a fishing product. It knows nothing about the lake underneath — no depths, no ramps, no fish, no water tests — and it will never tell you which of two lakes to drive to. We read weather too; the difference is that we read it against the water's own record. |
| FishingBooker | A real marketplace for guided trips, with real supply and real bookings. | It publishes no water data at all. It appears after the person has already decided where to go — we are there while they are deciding. |
| State agencies | The original source of most of our data, and genuinely authoritative: soundings, stocking records, ramp inventories, water sampling. | Unreadable. A PDF per lake, a different website per state, no way to compare two waters, and nothing that answers whether to go on Saturday. |
We have not found a product that does what we do: put the measured facts about a lake — depths, sampled water chemistry, stocking, ramps — on one page, keep it current, and say whether the fish are likely to feed today. Fishbrain has the community we do not. Omnia is closest on the map layers and sells tackle on top. The empty shelf is the measured half, published free.
The site is public in English and Spanish, with an assistant that answers from our data, maps we host ourselves, a bite forecast that updates with the weather, and an editing back office our content team uses every day.
Thirty-nine automated steps take a lake from a government dataset to a finished page: shoreline, depth chart, ramps, campgrounds, water tests, stocking, photos, translation. There is no per-lake cost to buy: no data licenses, no survey boats, no field staff. The marginal cost of one more lake is machine time on a server we already rent, plus an editor's read-through. Adding a state is running it more, not inventing anything.
The AI part that would normally cost the most runs on our own hardware. Map tiles are plain files on a server rather than a paid mapping service. We can swap the language model for a cheaper one in one line, because our data does the work, not the model.
The next twelve months
| Step | Lakes finished | What it makes possible |
|---|---|---|
| Finish Florida | about 250 | Proof that one state can be completed end to end. Subscription goes live. |
| Gulf coast states | about 900 | Enough coverage that guide and campground bookings become a real business, not a test. |
| The Southeast | about 2,400 | Big enough to sell licensing deals on coverage we already have rather than on promises. |
| National | about 12,000 | The point where catching up would take a competitor years. |
We are going state by state in order of how many anglers live there and how good the public data is. Florida is first because its wildlife agency publishes unusually well, which makes it the cheapest place to prove the whole thing works.
There is no technology risk left to take. The pipeline runs, the site is live, the forecast is honest, and the assistant cannot invent a lake that does not exist. What is left is volume: more surveys processed, more lakes finished, more states added. That is people and computing time, and it turns directly into published pages, search traffic and all four revenue streams above.
If you make fishing gear, run a marina, sell boats, promote a destination, or invest in outdoor businesses, the conversation is short: we can tell you which lakes your customers will be standing on this weekend, and why.
Vitalii Kindrakevych
Founder · Senior full-stack engineer · Cartagena, Spain
Ten years of shipping production systems and more than forty of them live — media, e-commerce, tourism, government, automotive, SaaS. Ran his own agency in Ukraine from 2014 to 2022, has been a senior engineering partner in Spain since. TripsQuick is built end to end by the same hands: the data pipeline, the map tiles, the search, the assistant, the site and the app.
kindrakevich.comDirectly relevant, already shipped
Semantic search over a mountain range, with an AI guide and a live trail map. The same problem as this one — public geodata turned into something a person can act on.
A fishing forecast built on Elasticsearch alone. The first version of the idea that became the bite score.
A retrieval assistant that refuses to answer anything it cannot support with your own documents — the rule our fishing assistant runs on.
 and the
 before you drive out.
Depth surveys, stocking records and water samples, straight from the public registries that hold them — brought together for one question: is it worth the drive?
