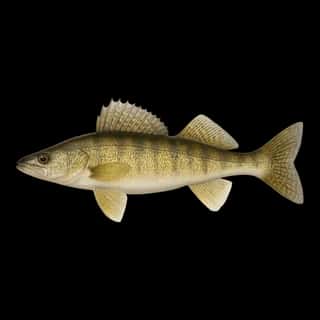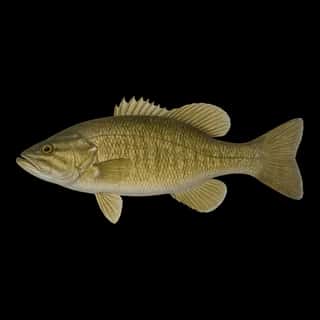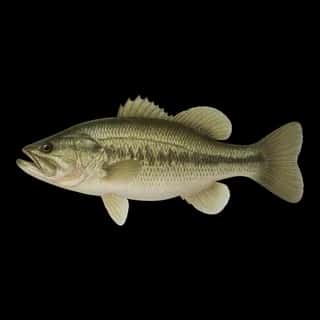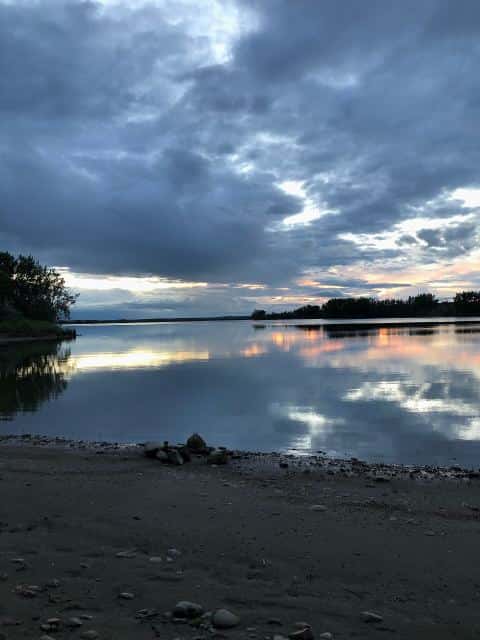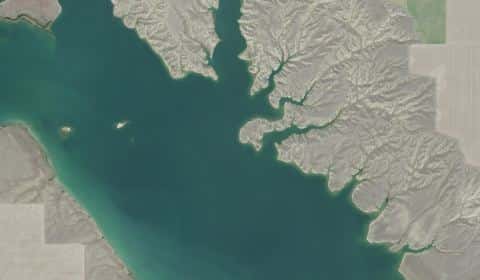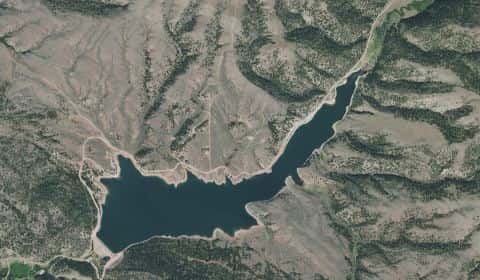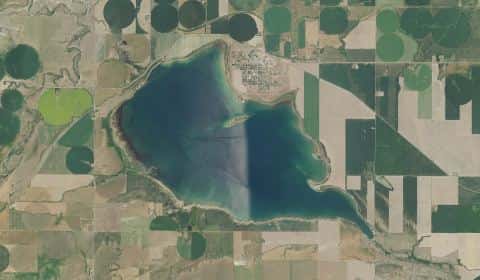
Nelson Reservoir fishing: Smallmouth Bass, Northern Pike, Walleye
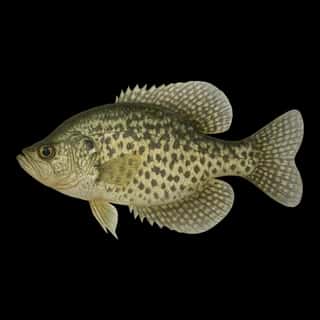
Target species: Smallmouth Bass, Northern Pike, Walleye, Largemouth Bass, Rainbow Trout, Black Crappie, Yellow Perch
The reservoir
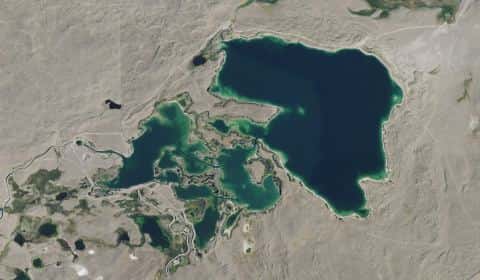
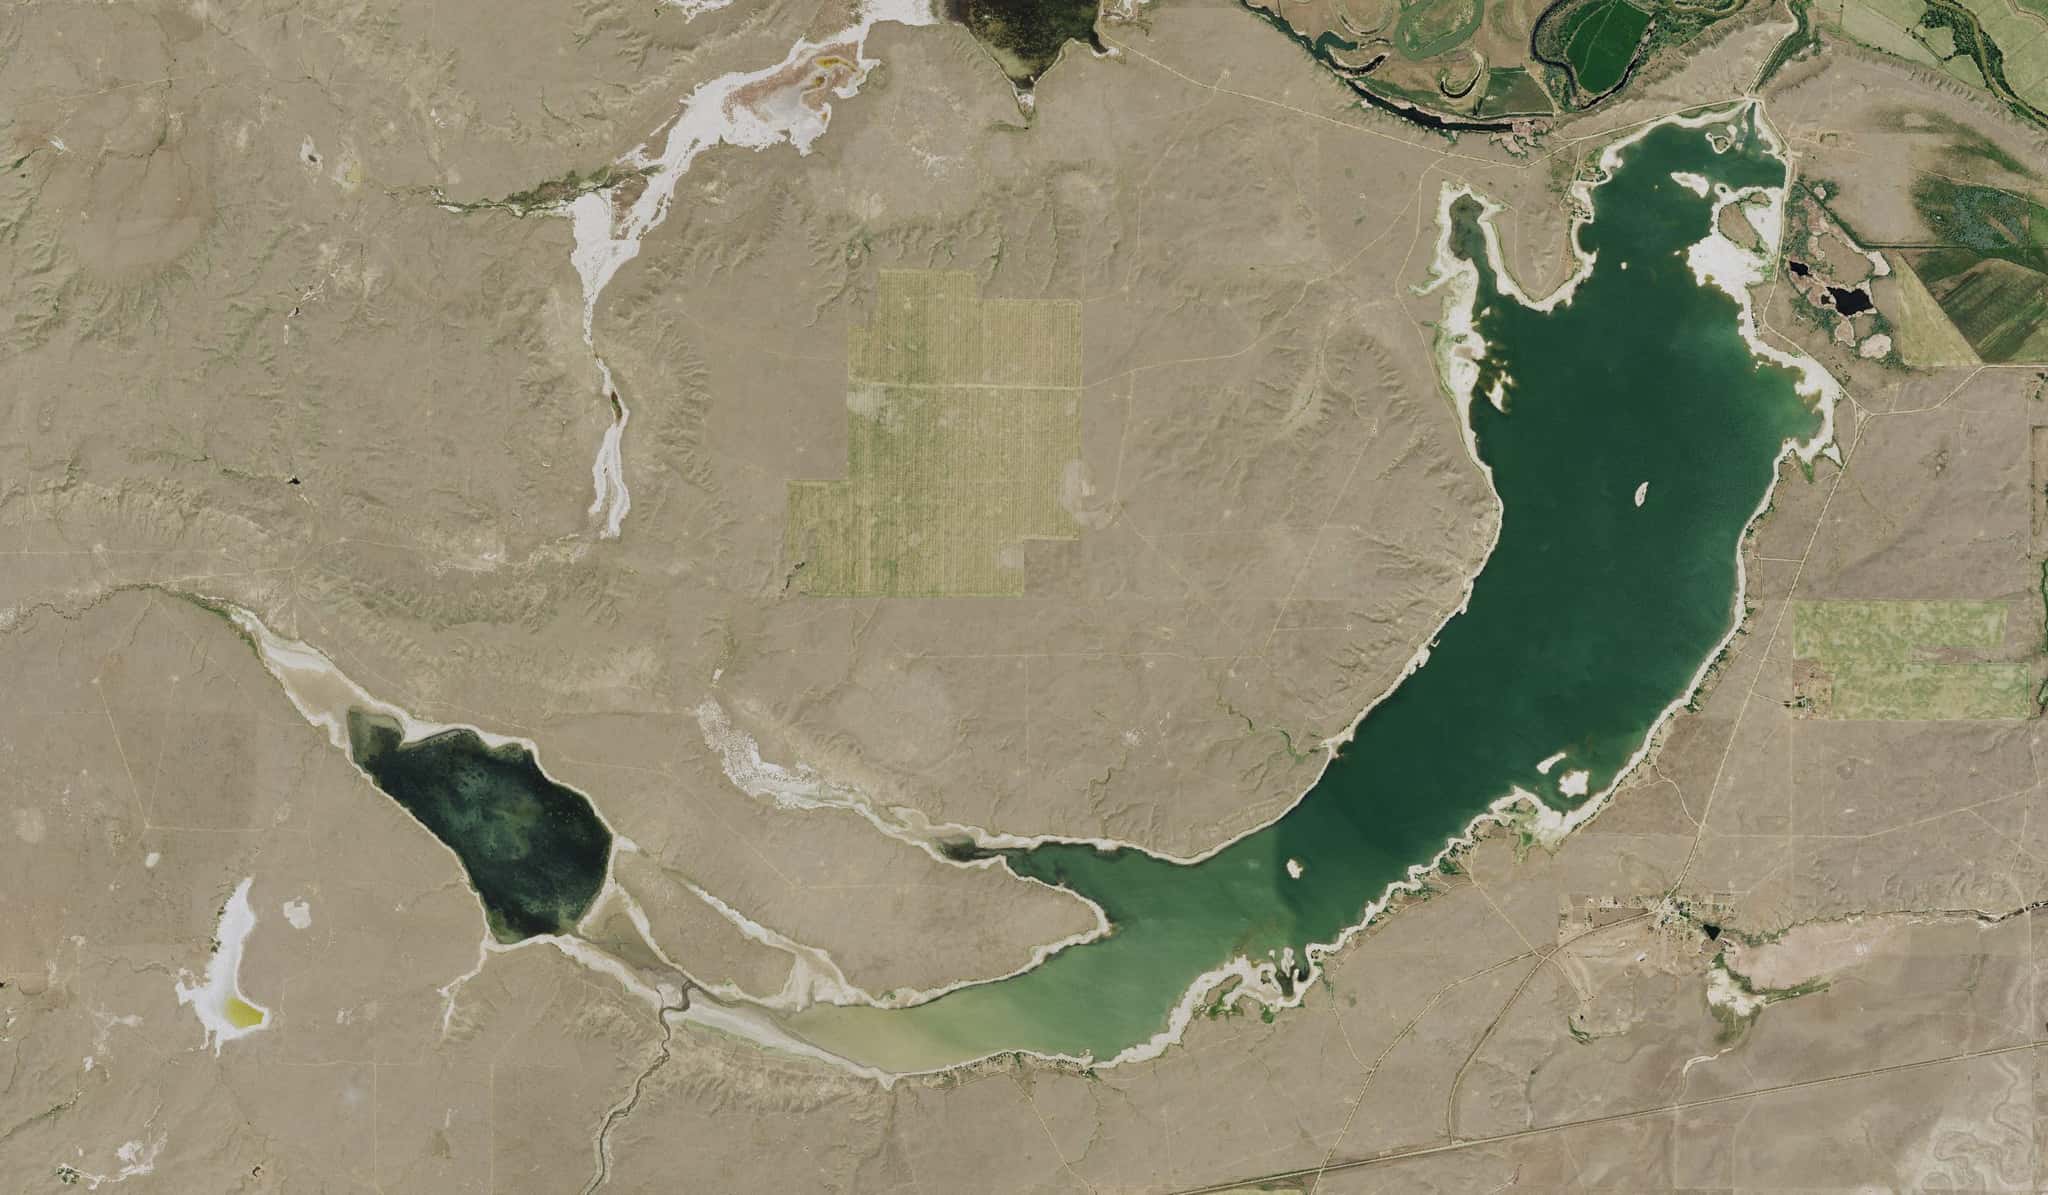
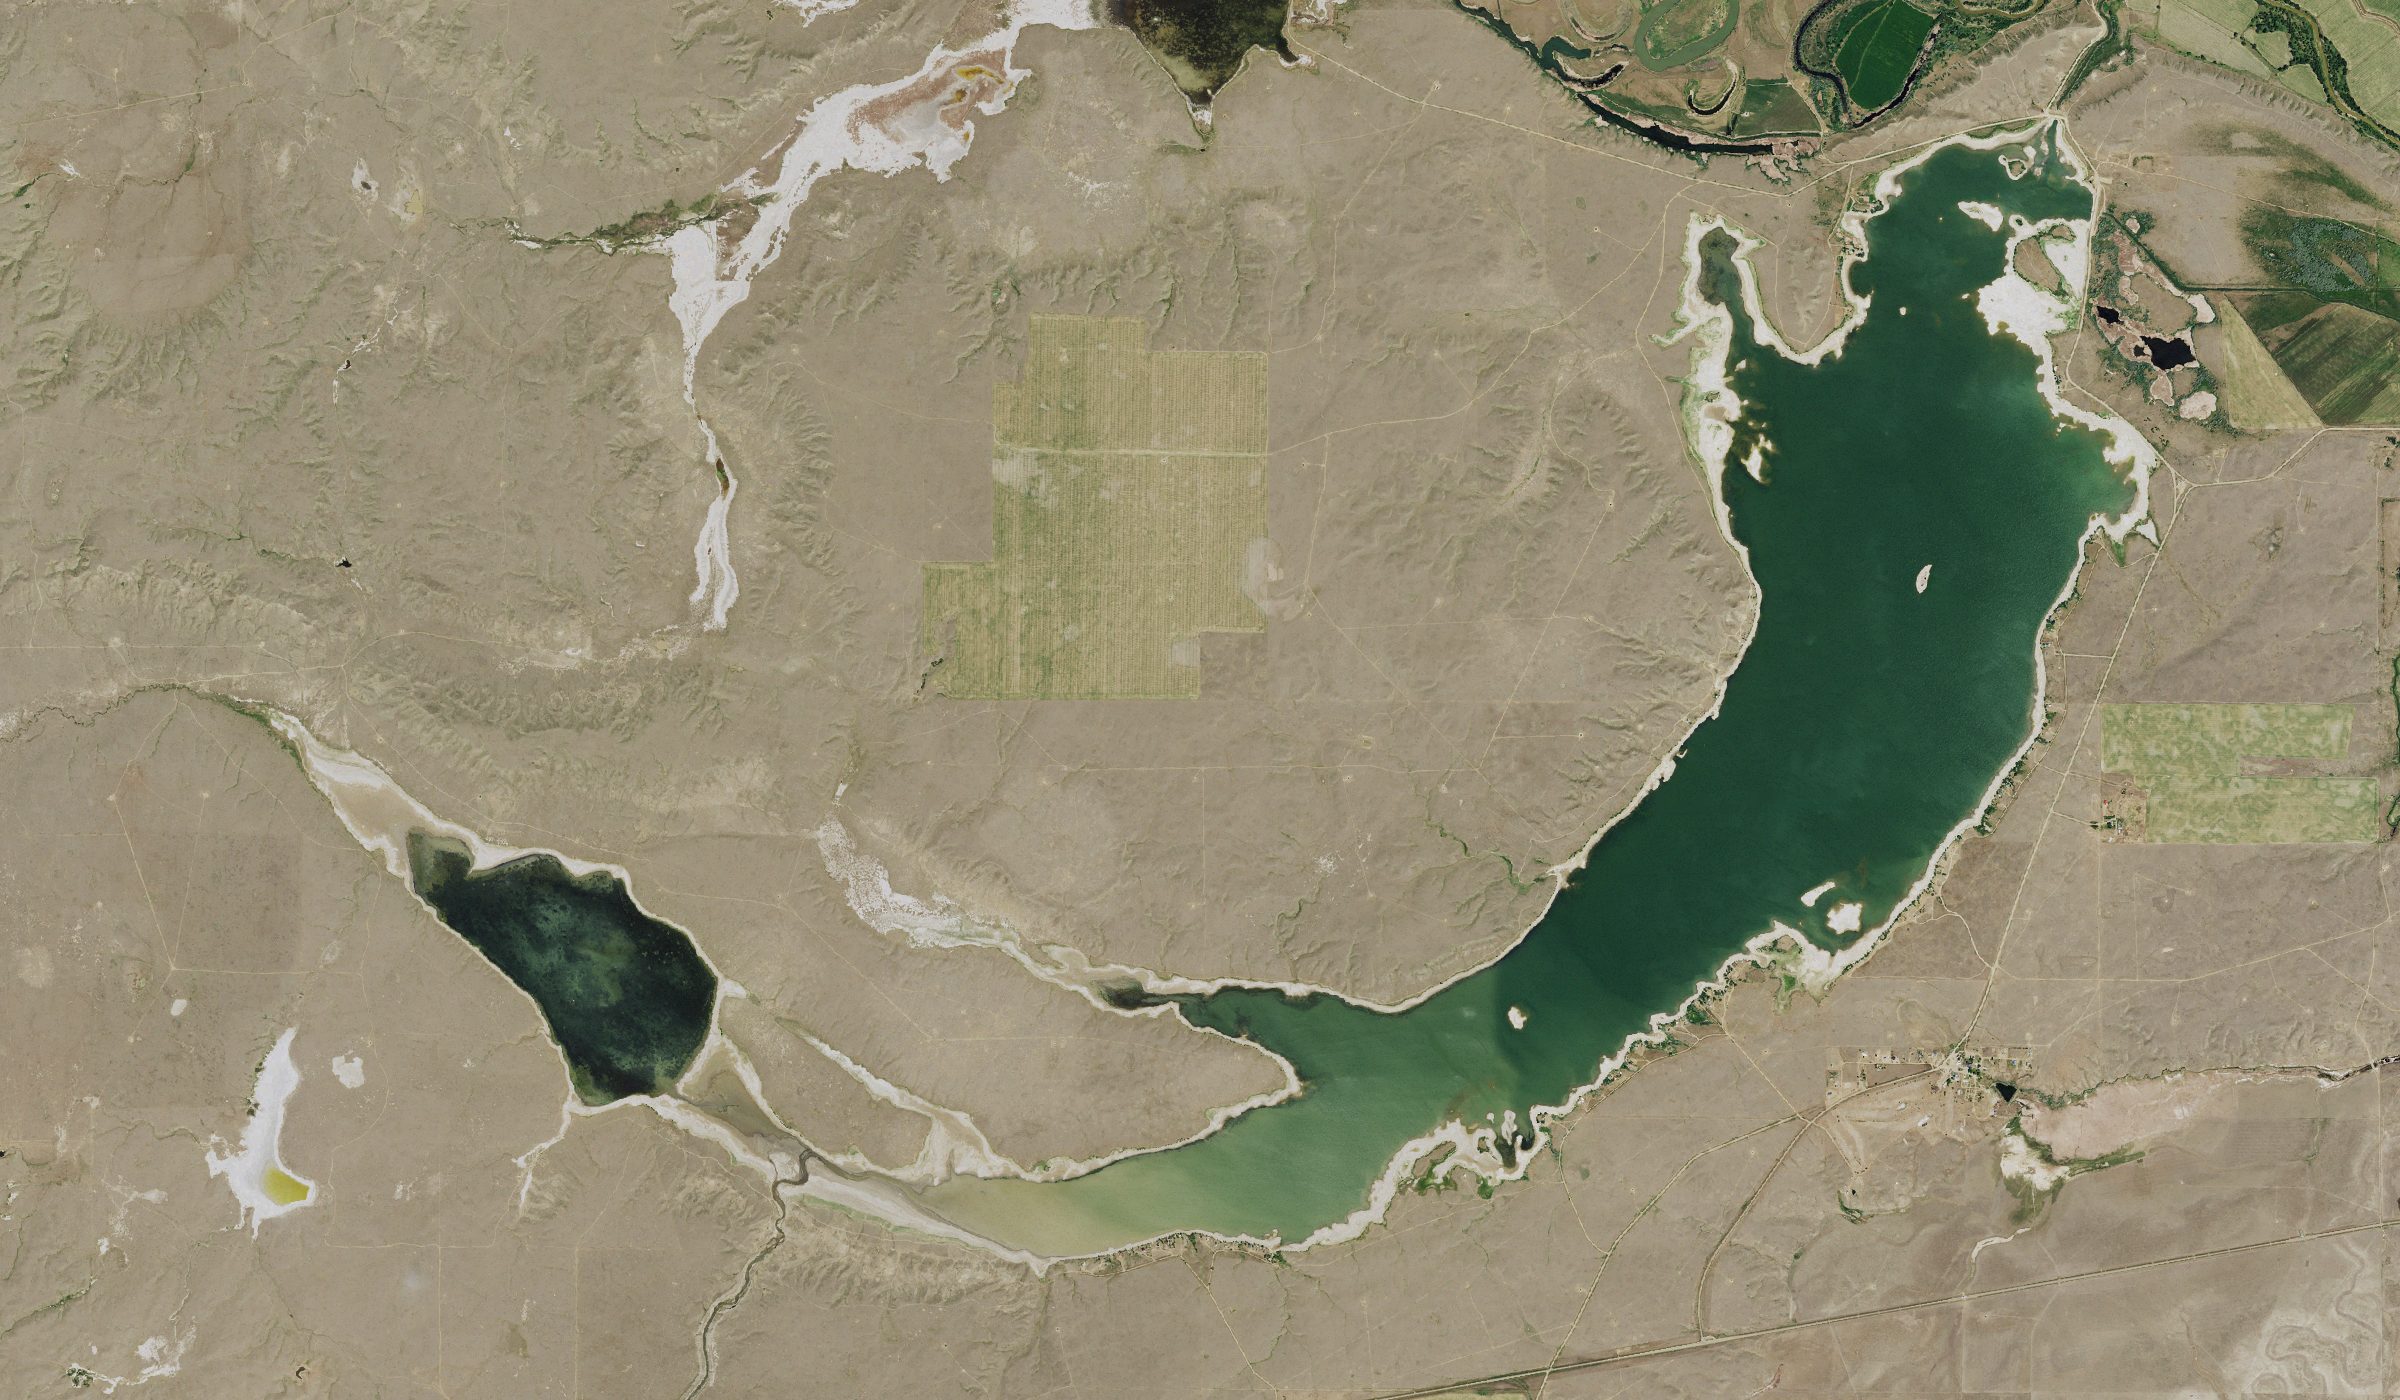
Nelson Reservoir covers 4,149 acres in Montana, across Phillips County. It is a reservoir: 93.2% of it is 36 feet deep or less; the deepest point measured is ≈42.5 feet (12.9 m). Our records hold 12 species for this water.
7 target fish, led by Smallmouth Bass
- Smallmouth Bass — Feeding water: 60–75°F.
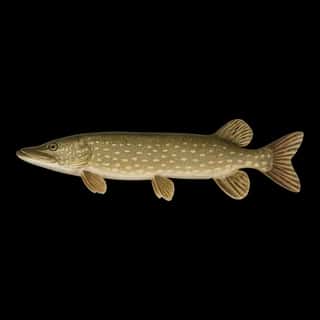
- Northern Pike — Feeding water: 50–75°F.
- Walleye — Feeding water: 50–75°F.
- Largemouth Bass — Feeding water: 65–85°F.
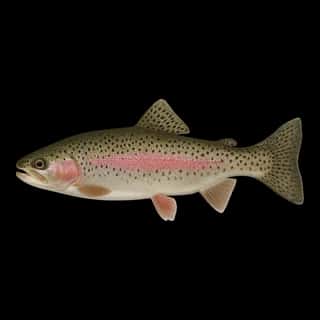
- Rainbow Trout — Feeding water: 50–65°F.
- Black Crappie — Feeding water: 65–75°F.
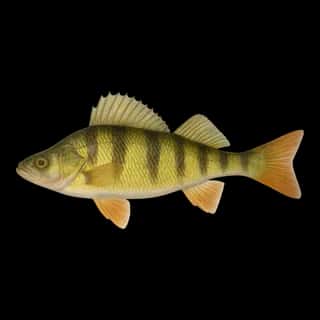
- Yellow Perch — Feeding water: 45–75°F.
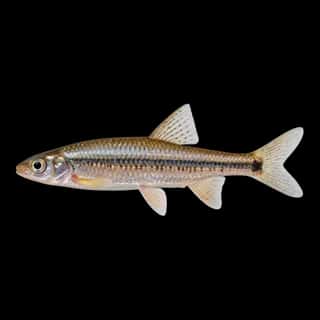
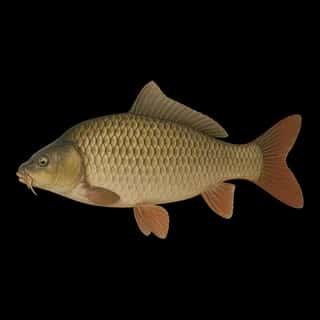
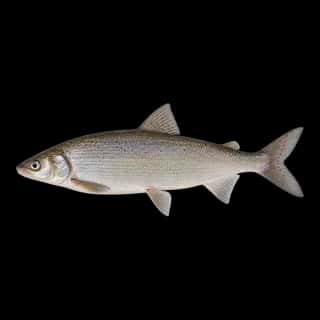
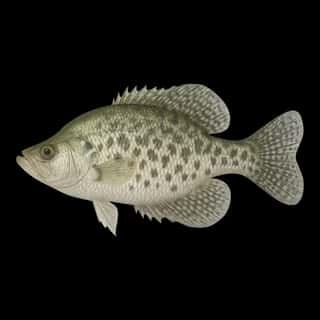
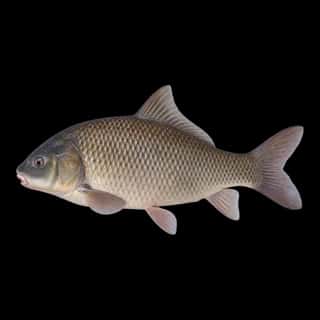
Also recorded here: Lake Whitefish, White Crappie, Bigmouth Buffalo, Common Carp, Spottail Shiner.
Stocking: 16,140,142 fish, 1988–2025
Montana Fish, Wildlife & Parks records list 16,140,142 fish released into this water from 1988 to 2025.
- Walleye: 10,335,632 in 2004–2025
- Northern Pike: 3,108,378 in 1951–2012
- Rainbow Trout: 30,515 in 1940–1984
- Yellow Perch: 10,000 in 1960
- Largemouth Bass: 5,400 in 1932
- Bigmouth Buffalo: 249 in 1970
4 more species on the stocking list.
Depth and bottom
Deepest measured point: ≈42.5 ft (12.9 m). 93.2% of the water is 36 feet or shallower. We hold 56 depth contours for this water, drawn from 167,544 soundings.
- 0–3 ft: 16.2% of the water
- 3–6 ft: 18.3% of the water
- 6–9 ft: 9.9% of the water
- 9–12 ft: 7.1% of the water
- 12–15 ft: 6% of the water
- 15–18 ft: 6.4% of the water
- 18–21 ft: 6.8% of the water
- 21–24 ft: 4.9% of the water
- 24–27 ft: 3.2% of the water
- 27–30 ft: 4% of the water
- 30–33 ft: 4.8% of the water
- 33–36 ft: 5.6% of the water
- 36–39 ft: 4.7% of the water
- 39–41 ft: 2.3% of the water
Water and conditions
Our water temperature readings average 66°F; they do not cover the whole year, so this is not a yearly average. pH averages 8.4. These readings span 2017. The latest reading is from 2017, more than three years ago: read these numbers as history, not as the water today.
Where this data comes from
- US Bureau of Reclamation — USBR reservoir sedimentation surveys: class A, a survey of the bottom, 1999.
- EPA NLA — EPA National Lakes Assessment: class B, a depth figure measured and published by an agency, without a bottom map.
- U.S. Bureau of Reclamation (RISE) — USBR area-capacity tables (RISE): class B, a depth figure measured and published by an agency, without a bottom map.
Part of these depths rest on an averaged water level, so they are approximate (≈).