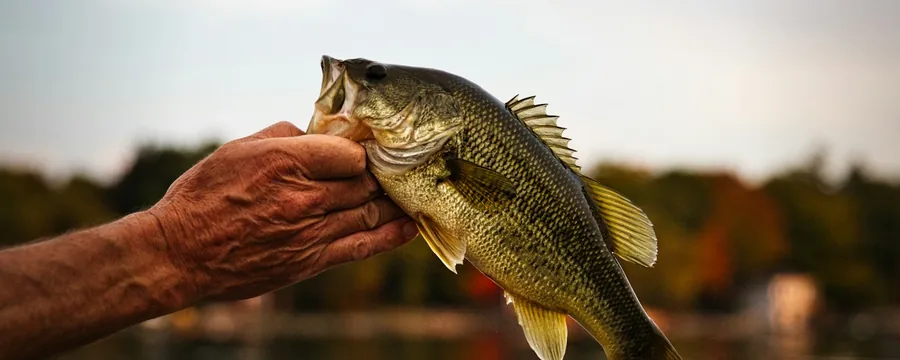
Bardwell Lake fishing: Striped Bass, Largemouth Bass, Blue Catfish
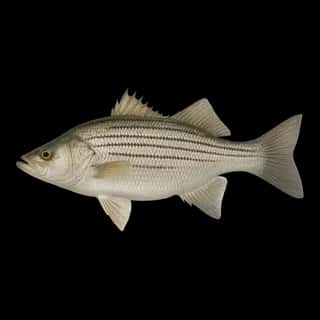
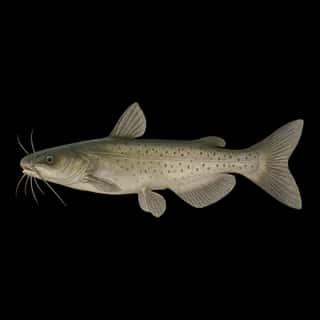
Target species: Striped Bass, Largemouth Bass, Blue Catfish, Channel Catfish, Sunshine Bass
The reservoir
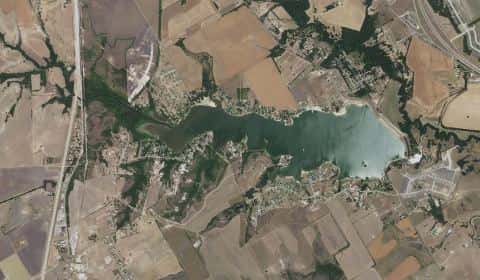
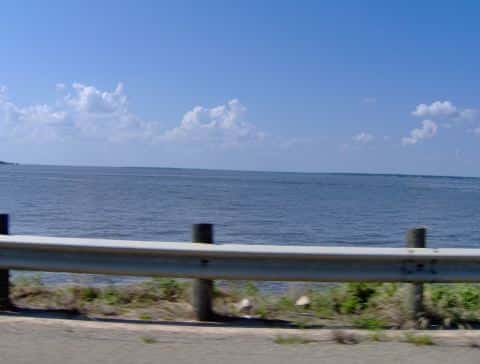
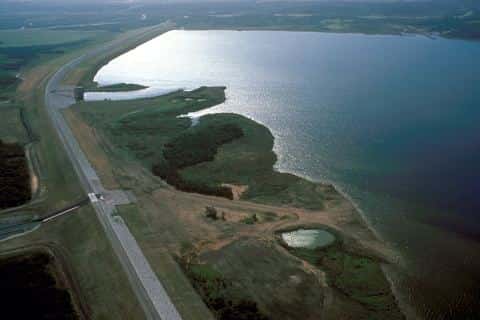
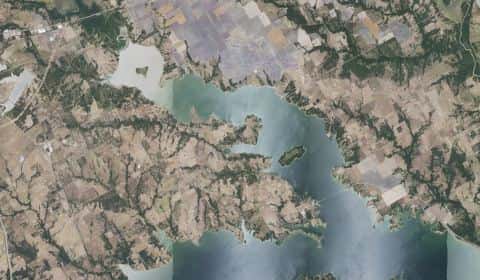
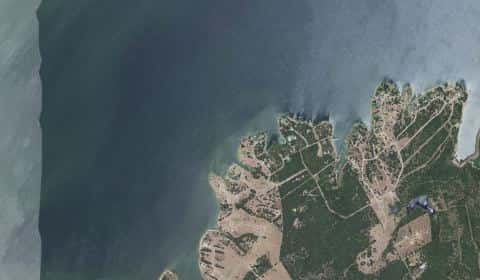
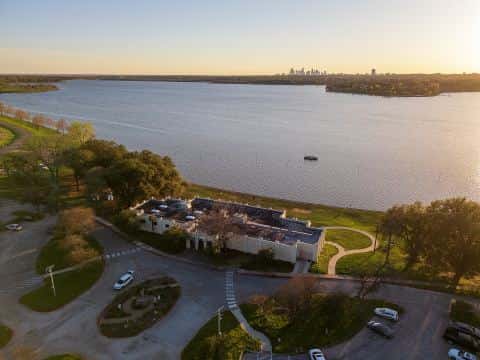
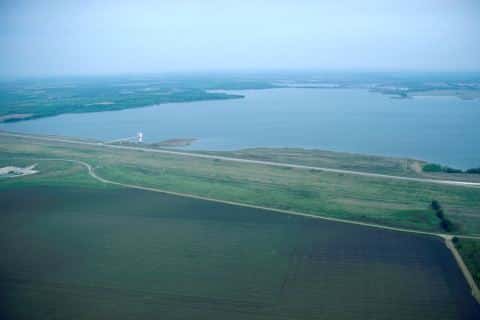
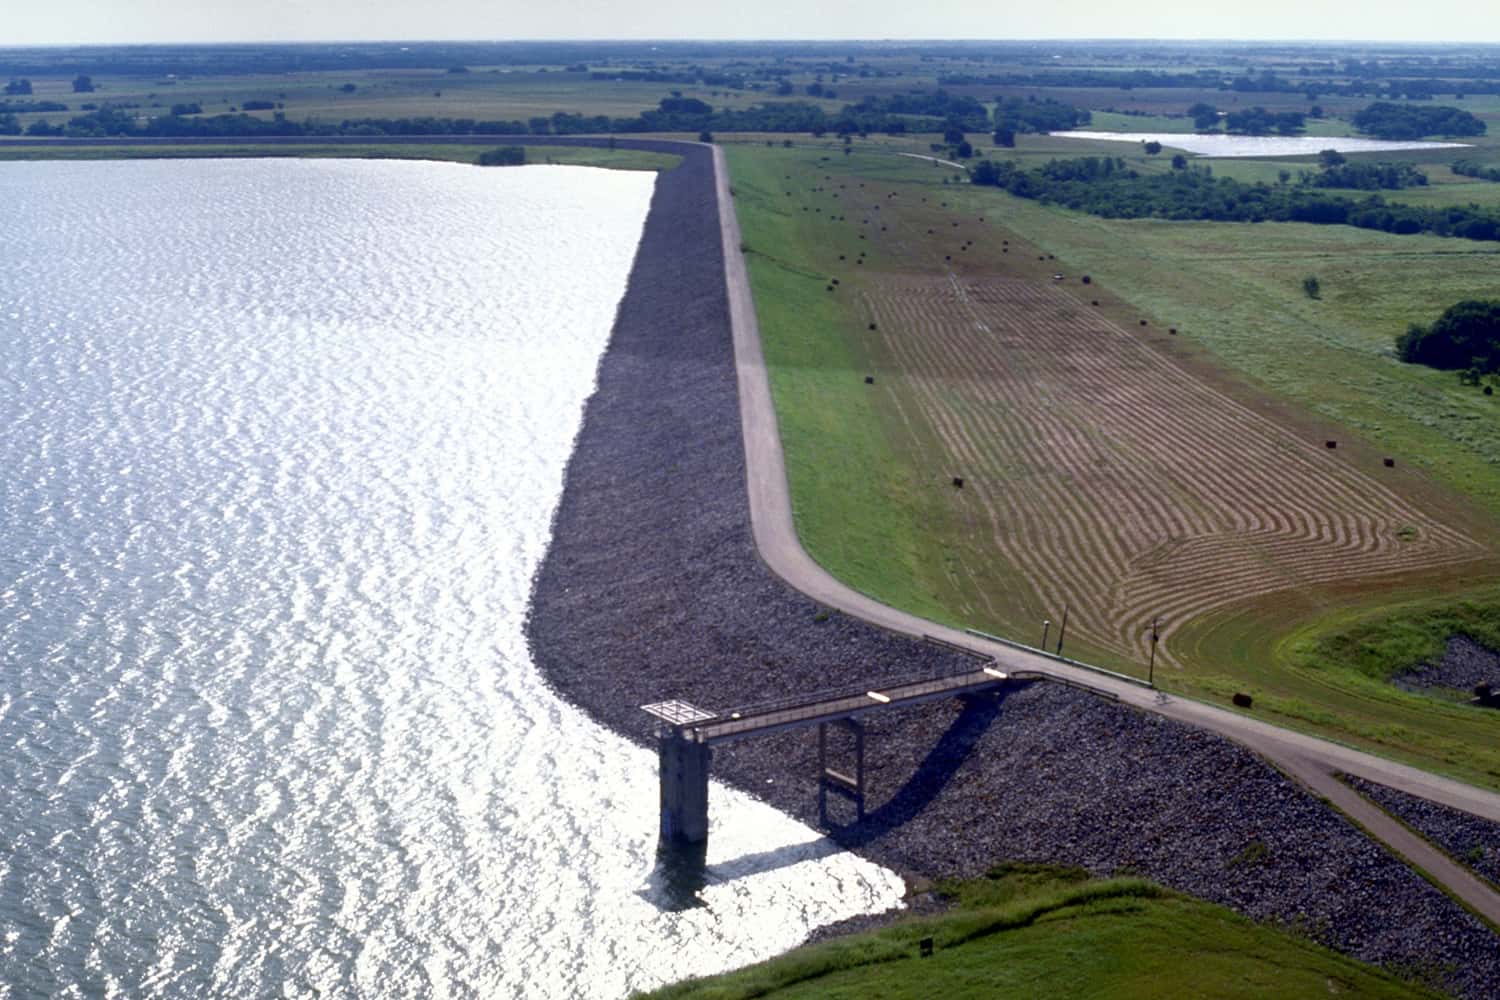
Bardwell Lake covers 3,283 acres in Texas, across Ellis County. It is a reservoir: 92.1% of it is 26 feet deep or less; the deepest point measured is 34.1 feet (10.4 m). Our records hold 6 species for this water.
5 target fish, led by Striped Bass
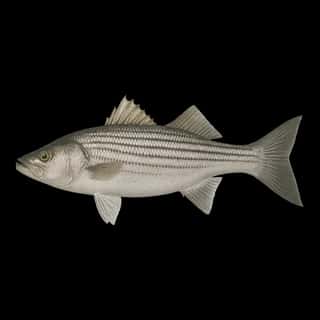
- Striped Bass — Feeding water: 60–75°F.
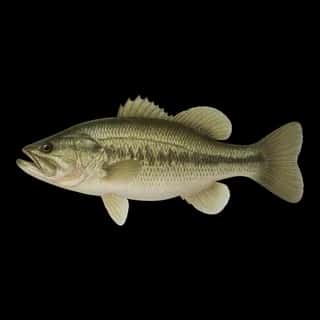
- Largemouth Bass — Feeding water: 65–85°F.
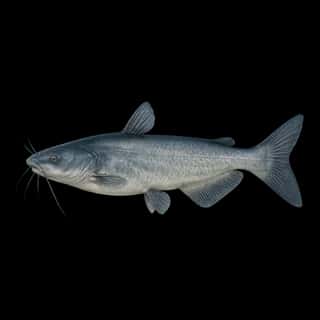
- Blue Catfish — Feeding water: 70–85°F.
- Channel Catfish — Feeding water: 70–85°F.
- Sunshine Bass — Feeding water: 70–80°F. Nonnative.
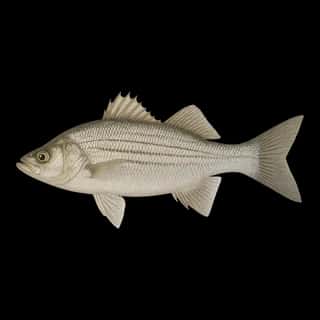
Also recorded here: White Bass.
Stocking: 5,169,236 fish, 1969–2025
Texas Parks and Wildlife Department records list 5,169,236 fish released into this water from 1969 to 2025.
- Largemouth Bass: 670,000 in 1966
- Blue Catfish: 591,280 in 1966–2022
- Sunshine Bass: 520,089 in 2015–2025
- Striped Bass: 501,545 in 1967–1994
- Channel Catfish: 24,000 in 1966–1972
3 more species on the stocking list.
Depth: down to 34.1 ft at the deepest measured point
Deepest measured point: 34.1 ft (10.4 m). 92.1% of the water is 26 feet or shallower. We hold 60 depth contours for this water, drawn from 130,922 soundings.
- 0–2 ft: 8.9% of the water
- 2–4 ft: 8.3% of the water
- 4–6 ft: 9.2% of the water
- 6–8 ft: 9.9% of the water
- 8–10 ft: 8.2% of the water
- 10–12 ft: 6.1% of the water
- 12–14 ft: 6.9% of the water
- 14–16 ft: 5.1% of the water
- 16–18 ft: 4.4% of the water
- 18–20 ft: 6.9% of the water
- 20–22 ft: 5.6% of the water
- 22–24 ft: 6.4% of the water
- 24–26 ft: 6.2% of the water
- 26–28 ft: 4.4% of the water
- 28–30 ft: 2.5% of the water
- 30–32 ft: 0.8% of the water
- 32–33 ft: 0.3% of the water
Where this data comes from
- Texas Water Development Board — Texas Water Development Board: depth contours: class A, a survey of the bottom, 2020.
- USACE CWMS — USACE CWMS elevation-area curves: class B, a depth figure measured and published by an agency, without a bottom map.